
Reporting results of independent sample t-test
Introduction
The Independent samples t test is a parametric test for comparing means of two independent groups in order to determine whether there is statistical evidence that the associated population means are significantly different. This test is sometimes referred to as:
- Independent t test
- Independent measures t test
- Independent two-sample t test
- Student t test
- Two-Sample t test
- Uncorrelated scores t test
- Unpaired t test
- Unrelated t test
The independent samples t-test can only compare the means for two (and only two) groups. It cannot make comparisons among more than two groups. If you wish to compare the means across more than two groups, you will likely want to run an Analysis of Variance (NOVA).
Learning Outcomes
By the time you complete this lesson, you should be able to:
- interpret output of the SPSS procedures on 2-sample t test
- report results from independent samples t test in APA style
Problem Statement
The hypothetical study evaluates the effect of PowerPoint on test scores of students. The sample for the study comprises 18 students randomly assigned to two groups – treatment and control:
- 8 weekend students by treatment – receiving instructions with PowerPoint intervention
- 10 regular students by control – receiving instructions with no PowerPoint intervention
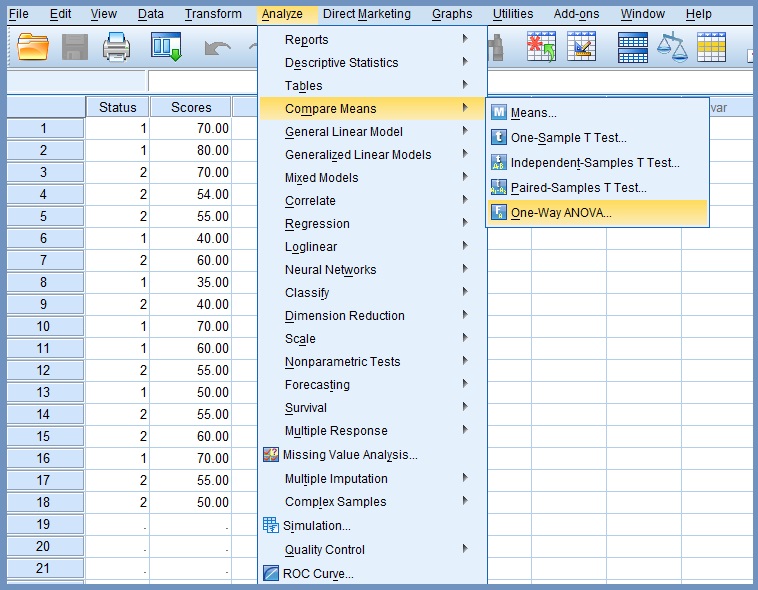
The performance of the 18 students at the end of the training is expressed as Scores. For Status, the numbers 1 and 2 represent PowerPoint instructions and no PowerPoint instructions respectively. The SPSS data view of the sample data is shown in Figure 1.

Note
Assumption 6: No Outliers
There should be no significant outliers. Outliers are simply single data points within a dataset that do not follow the usual pattern. Their presence in a dataset can reduce the validity of t test results.
Outliers represent natural variations in the population, and can be overlooked. Other outliers may result from incorrect data entry, equipment malfunctions, or other measurement errors. They are deemed problematic and should be removed.
Striking off outliers is usually a judgment call. In our sample, we chose not to delete outliers since the dataset is a collection of fictitious data meant to demonstrate the concept of 2-sample t-test.
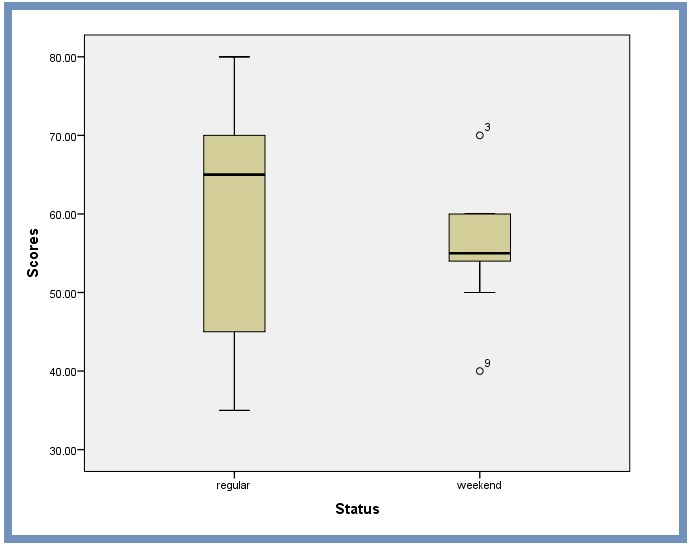
We can use the box plot in Figure 9 to detect if any outliers exists in our dataset. The box plot demonstrates the central value (50%) of the data, with a line in the middle that shows the median value. The lines extending from the box capture the range of the remaining data.
Any data point that falls outside the lines indicates an outlier. SPSS uses a circle (°) or a Star (*) to mark any outliers. The number next to an outlier icon corresponds to the listed item in the dataset. This corresponds to the third (70.00) and ninth (40.00) of our dataset, see Figure 1.
Note
Interpreting Output of 2-Samples t-Test
The output for independent samples t-test produces two tables: Group Statistics and Independent Samples Test.
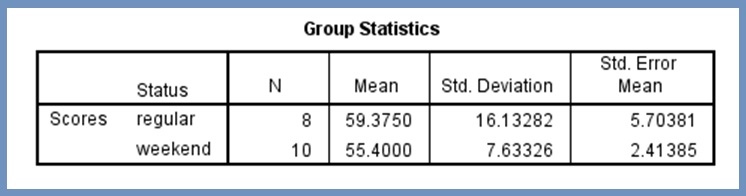
Group Statistics. The descriptive statistics for the independent samples t-test is displayed in Figure 24. The mean Scores for instructions with PowerPoint intervention (weekend) is [M=55.4000, SD=7.63326] and mean scores for instructions with no PowerPoint intervention (regular) is [M= 59.3750, SD=16.13282].
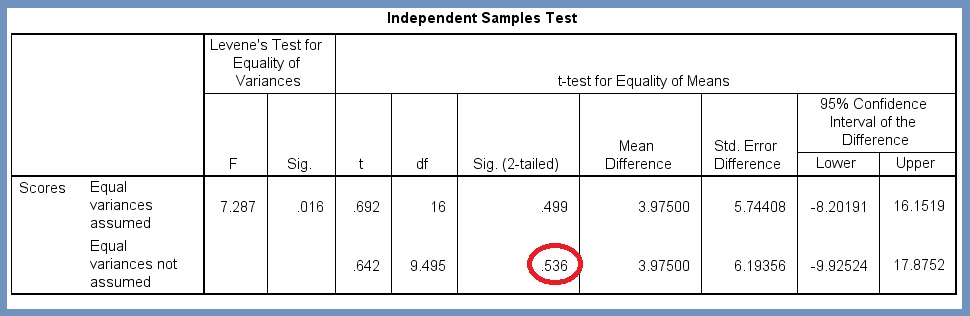
Independent samples t test. The output for independent samples t-test is displayed in Figure 25. There are two columns that provide different pieces of information:
- Levene’s Test for Equality of Variances
- t-test for Equality of Means
Levene’s test for equality of variances. This test determines whether the two conditions (PowerPoint intervention/no PowerPoint intervention) have about the same or different amounts of variability between scores.
From Figure 25, the F test statistic is 7.287, and the p-value is 0.016. This value is less than our α value, i.e., 0.016 < 0.05. Therefore, we reject the hypothesis of equal variances.
This result suggests our data does not meet the assumption of homogeneity of equal variance, and that the independent-samples t-test is not the suitable statistical test for our data. However, we can resort to a different t-test, known as the Welch t-test, which makes a robust adjustment for unequal variances.
In practical terms, we can go ahead with the assumption of unequal variances for the two groups. In that case, we use the data from the bottom row under t-test for Equality of Means (Figure 25) or run Welch’s test to do our analysis.
The output for test of homogeneity of variance produces a bunch of results which includes Welch’s robust test of equality of means, Figure 26. Once again, we return to our previous test on how to run Welch’s test for unequal variance.
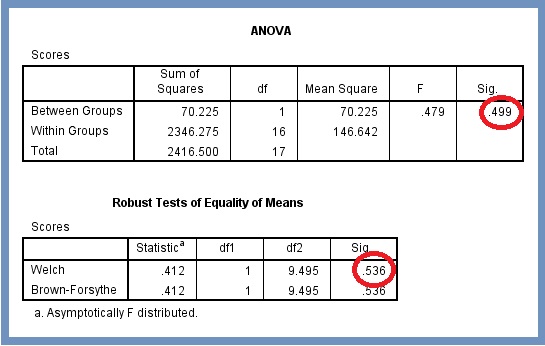
Welchs robust t-test for equality of means. We can state the statistical hypothesis for Welch’s test as:
- Null hypothesis (Ho): the two group means are identical.
- Alternative hypothesis (Ha): the two group means are different
Since the p-value is greater than alpha (.536 > .05), Figure 26, we fail to reject the null hypothesis of the test. We conclude that there is not sufficient evidence to state that the means of the two populations are significantly different.
Note
Reporting 2-Samples t Test Conclusions in APA Style
To report our conclusions in APA style, we consider the following three main statements:
Test type and use. Here, we tell our readers the type of test we conducted:
“An independent samples t-test was conducted to compare mean scores of weekend students using PowerPoint for instructions and mean scores of regular students who did not use PowerPoint for instructions.”
Significant differences between conditions. We tell our readers whether or not there was a significant difference between the two means by using descriptive data in Figure 24.
“There was no significant difference in the Scores for instructions with PowerPoint intervention (M=55.4000, SD=7.63326) and instructions with no PowerPoint intervention (M= 59.3750, SD=16.13282); t (16)=0.642, p=0.536.”
Reporting results in APA style. We now merge and report the two statements while emphasising on verb tenses, italicization and decimals of results:
An independent samples t-test was conducted to compare the mean scores of Weekend students who received instructions with the use of PowerPoint, and the mean scores of Regular students who received the same instructions with no PowerPoint intervention. There was no significant difference in the mean scores for the Weekend students (M=55.40, SD=7.63) and Regular students (M=59.38, SD=16.13) conditions; t (16)=.64, p=.54. The results suggest the use of PowerPoint for instructions does not have any significant effect on performance of learners. Specifically, this means when students take instructions with the aid of PowerPoint, their scores do not increase.
Citation Information
If you want to cite this lesson, you may use the following APA information:
- Author: Mahama, A.
- Date of publication: Use the 2023, February 27 or the last date the lesson was modified.
- Title: Conducting independent sample t test
- URL of lesson: https://thecalleacademy.thecallinfo.com/courses/research/data-analysis-1/lessons/conducting-independent-samples-t-test/
- xxx is the date thus lesson is retrieved
Example
Mahama, A. (2023, August 26). Conducting one sample t test. Retrieve xxx from https://thecalleacademy.thecallinfo.com/courses/research/data-analysis-1/lessons/conducting-independent-samples-t-test/
References
Daniel, T. (202017, December 10). https://youtu.be/-qGFZFOQx7Q [Video]. Retrieved August 18, 2023 from YouTube: https://youtu.be/vII22ZnFOP0
Editorial Director. (2023). How should p values be reported? Retrieved June 02, 2023 from
https://support.jmir.org/hc/en-us/articles/360000002012-How-should-P-values-be-reported-
Kent State University. (2021). Paired samples t test. Retrieved February 11, 2023 from https://libguides.library.kent.edu/spss/pairedsamplesttest
Lund Research Ltd. (2018). Dependent t-test using SPSS statistics. Retrieved July 15, 2023 from
https://statistics.laerd.com/spss-tutorials/dependent-t-test-using-spss-statistics.php
Zach, B. (May 29, 2019). Welch’s t-test: When to use it + examples. Retrieved September 10, 2023 from http://www.statology.org/welchs-t-test/
▣▣▣
